The Most Important Chart Of The Bitcoin Bull Market Hits $94,000.
- Posted on June 7, 2024 12:44 PM
- Cryipto News
- 1067 Views
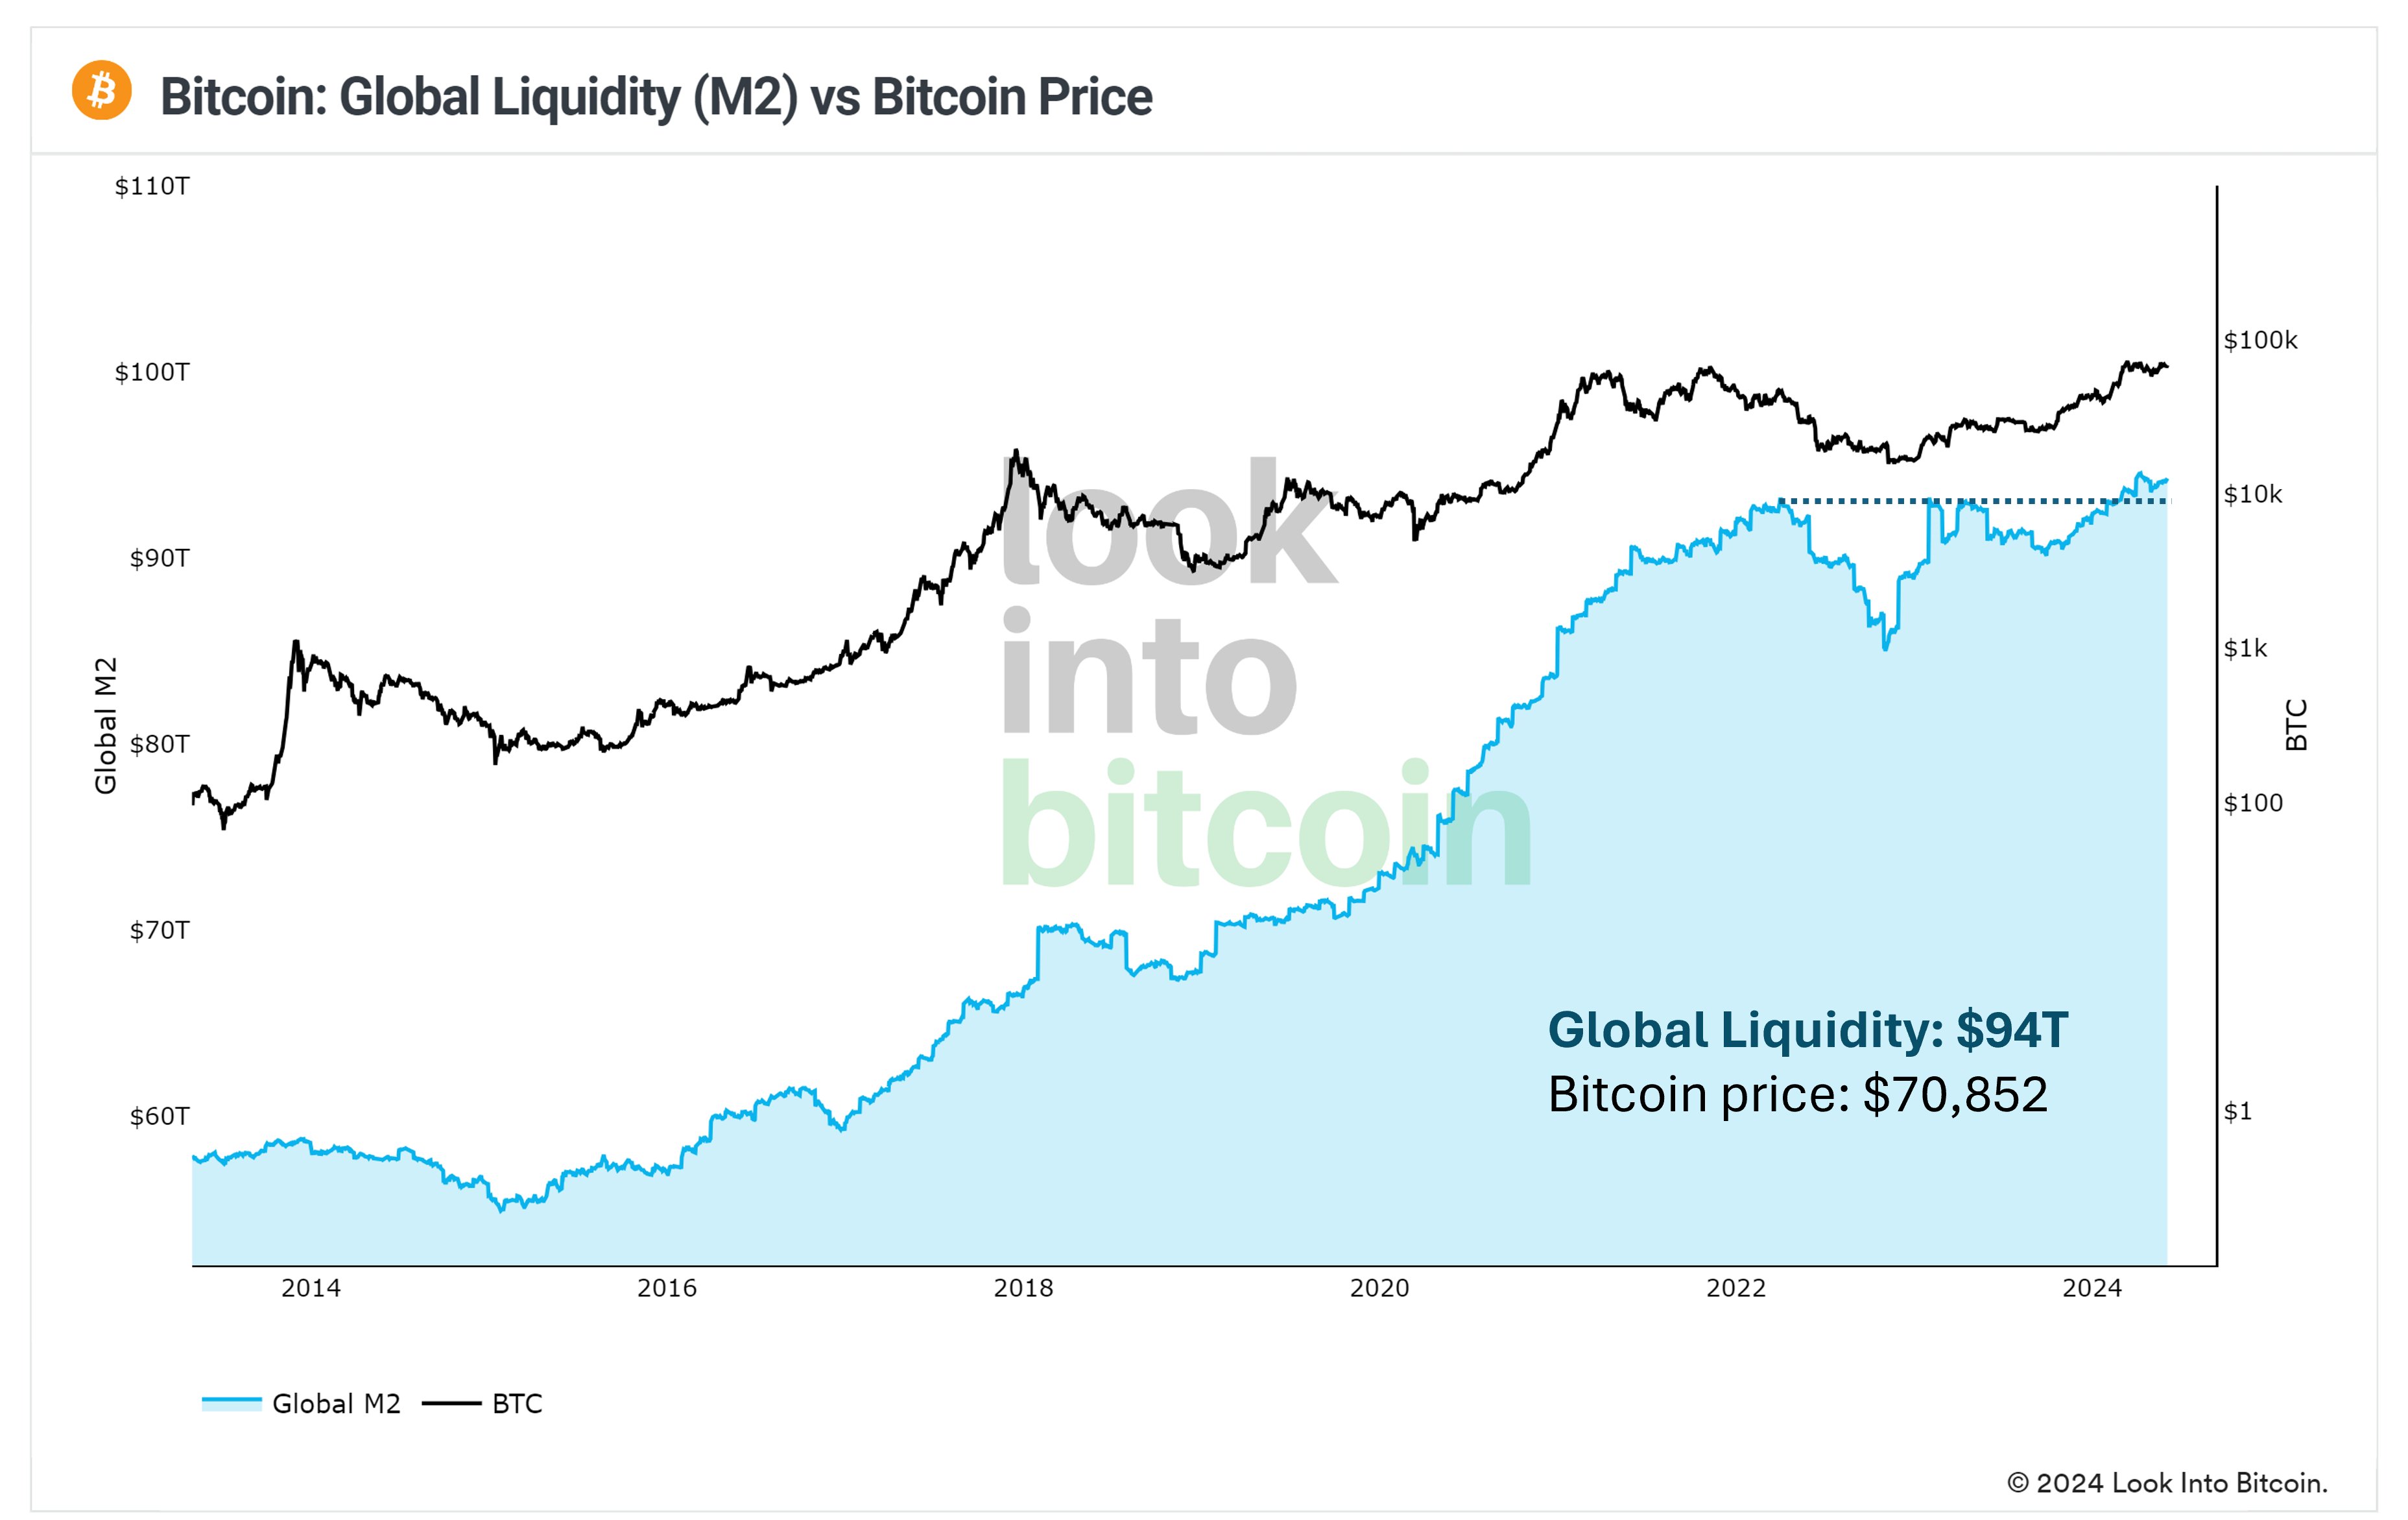
Will the global liquidity reaching $94 trillion accompany Bitcoin's reaching new highs once again?
Bitcoin is finding support in a bull rally as global liquidity reaches record levels.
According to an analysis shared by Philip Swift, the founder of LookIntoBitcoin, on June 5, it is observed that global liquidity is approaching $100 trillion.
It remains a matter of curiosity whether the global liquidity record will drag Bitcoin along. Bitcoin and the crypto markets usually respond very sensitively to global liquidity trends. The approach to $100 trillion in liquidity in 2024 could create a favorable ground for the continuation of the rise in Bitcoin.
Swift's idea, comparing the M2 money supply to Bitcoin price movements, supports this view. The M2 money supply in US dollars is currently at the level of $94 trillion. This figure is $3 trillion higher than the days when Bitcoin hit a record high in 2021. M2 declined to $85 trillion towards the end of 2022 (the days when the bottom of the crypto bear market was seen) and then increased by 10%.
In his Twitter post, Swift emphasized that the M2 money supply chart is the most important graph, asking, "Are you ready?"
The data presents consistent findings with other recent liquidity-based indicators regarding the rise of Bitcoin.
As Bitcoin reached new highs, coinciding with the end of the longest consolidation period in the history of the US M1 money supply, the question now arises: Will Bitcoin repeat the scenario of 2020?
Analysts believe that with improving financial conditions, institutional investors will show increased interest in cryptocurrencies and other risky assets.
According to the latest weekly report from the on-chain analysis platform CryptoQuant, there are parallels with investor behavior in 2020. "Large investors moved approximately $1 billion worth of Bitcoin daily during the rally that took the price from $10,000 to $70,000. In 2020, Bitcoin traded around $10,000 for six months of intense on-chain activity before rallying with OTC (Over The Counter) transactions."
Despite low price volatility, on-chain activities are reportedly continuing at high levels. It is noted that new whale wallets are adding approximately $1 billion worth of BTC every day, likely occurring in wallets of institutional investors.
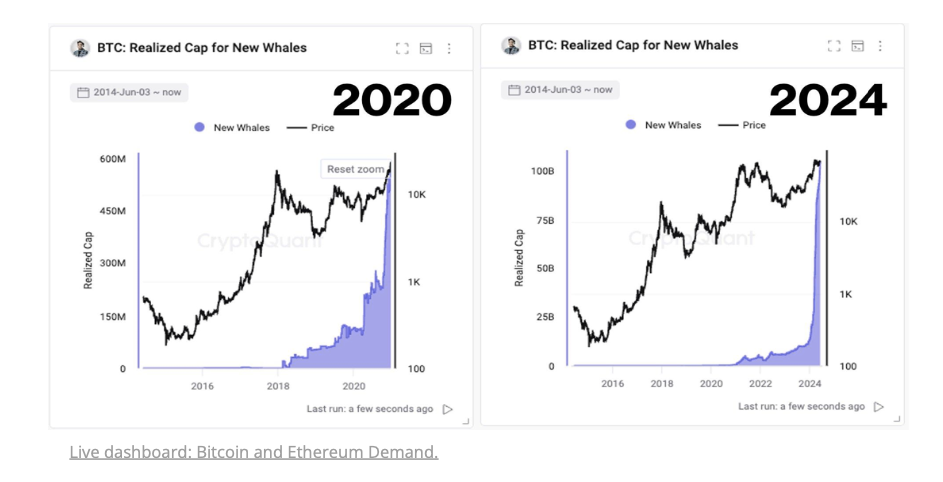
The attached graph compares the total cost basis, also known as "new whales," or "realized price," from 2020 to 2024.
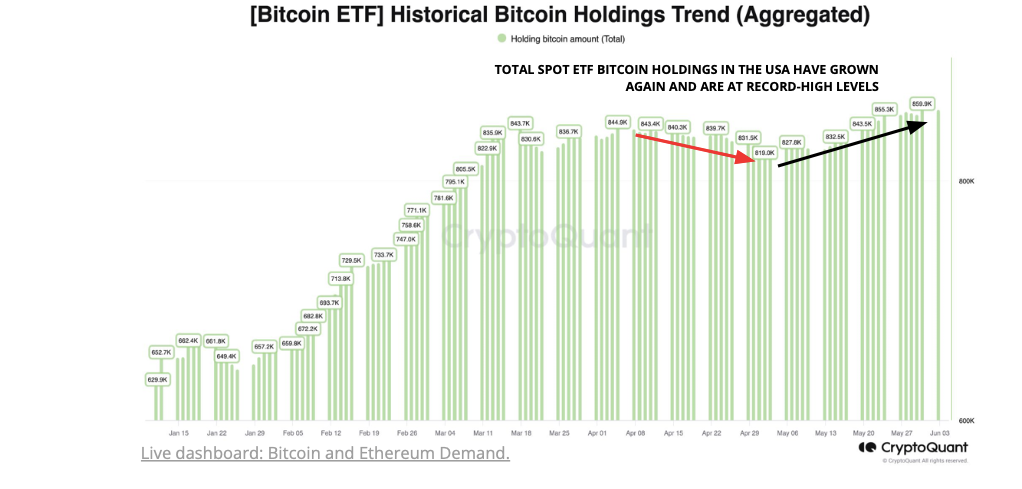
CryptoQuant highlighted the second-highest net inflow recorded in spot Bitcoin ETFs in the United States on June 4th.
You can follow the latest developments and news in the cryptocurrency markets on Kriptospot.com.