The Data On Ethereum Indicates A Bullish Signal.
- Posted on July 13, 2024 7:33 AM
- Cryipto News
- 969 Views
Three key Ethereum price indicators suggest that ETH is poised for a rally above $3,400.

The price of Ether fell by 18% to $2,826 between July 1 and July 8, but the recovery was swift. Investors experienced disappointment during this period as $313 million in leveraged long positions were liquidated. Although the current price of $3,100 is below the previous $3,400 resistance, Ether traders are gradually regaining confidence through on-chain and derivative metrics.
Ether Supply on Exchanges Continues to Decline
Even though the launch of the spot Ethereum exchange-traded fund (ETF) in the United States may take longer than expected, strong fundamentals suggest that prices could recover soon. Gary Gensler, Chairman of the U.S. Securities and Exchange Commission, indicated that approvals for S-1 filings could be expected "in the summer months," meaning before the end of September. However, the exact timeline remains uncertain, leaving traders with reasons to remain skeptical.
Similarly, the excitement for Bitcoin ETFs is rising, with $654 million inflows over the past three days. Matt Hougan, Chief Investment Officer at Bitwise, suggested that spot Ethereum ETFs could attract up to $15 billion in the first 18 months of trading.
Even if this forecast is off by 50%, analysts believe that the price of Ether will benefit from the portion of supply locked in staking and decentralized applications (DApps).
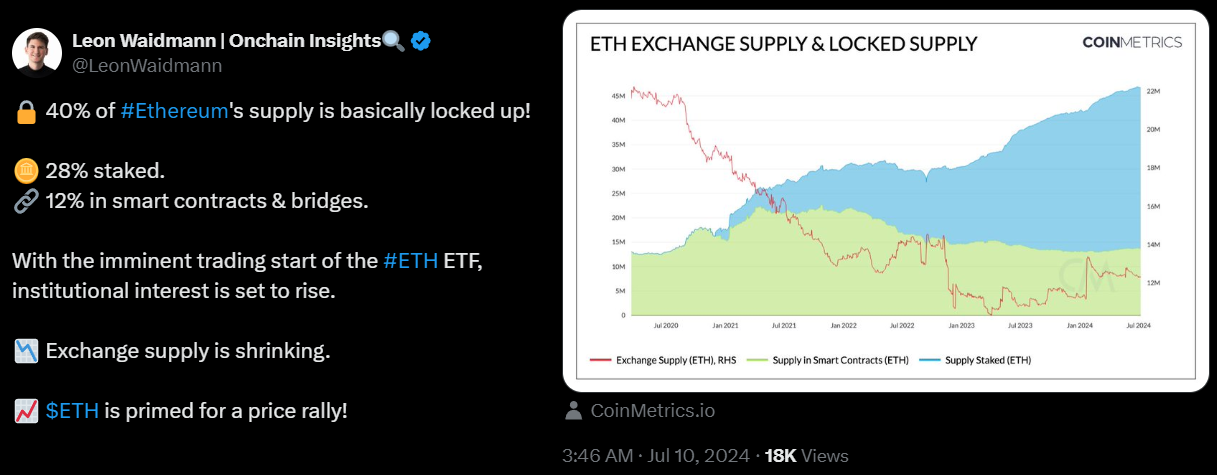
On-chain analyst Leon Waidmann reports that 40% of Ether's supply is locked, considering staking and DApps. He also highlights that the supply of Ether on exchanges has decreased over the past month. Glassnode data shows that deposits on exchanges have fallen from 13.34 million ETH two months ago to 12.21 million ETH.
Overall, the reduced availability of coins for immediate trading suggests that investors are less likely to sell in the short term.
The total value locked (TVL) in Ethereum's network, including layer-2 bridges and the DApp ecosystem, has remained stable at 17.7 million ETH over the past month. This data supports the notion that liquidity on centralized exchanges is declining. Furthermore, with average transaction fees surpassing $2—significantly higher than those of competitors like Solana (SOL) and BNB Chain (BNB)—Ethereum demonstrates resilience.
Ethereum layer-2 solutions have seen significant growth over the past month, as investors seeking lower fees have increasingly adopted them.
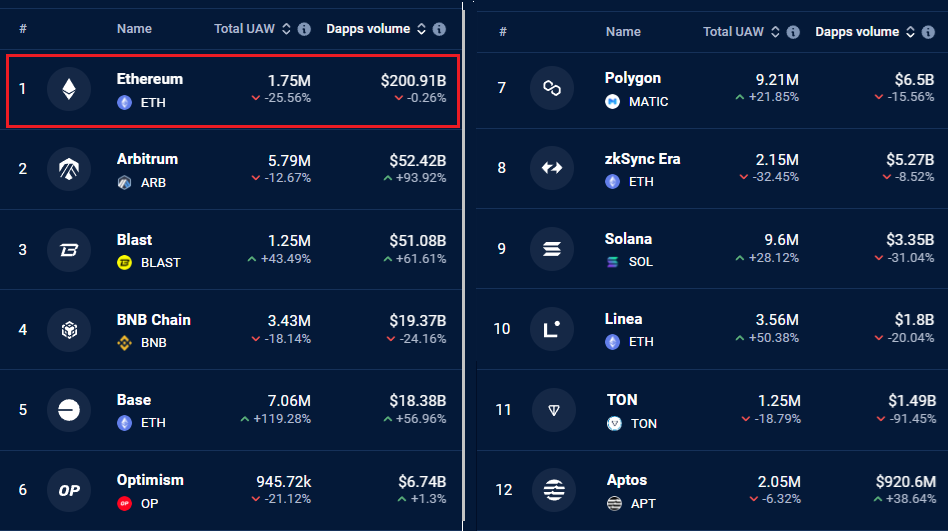
In the past 30 days, Ethereum DApps recorded a total trading volume of $200.9 billion. During this period, layer-2 solutions within the ecosystem saw significant expansion. For instance, Arbitrum's volume increased by 4% to $52.4 billion, Blast's volume grew by 62% to $51.1 billion, and Base's volume rose by 57% to $18.4 billion. Meanwhile, its direct competitors, BNB Chain and Solana, experienced an average decline of 27% in their volumes during the same timeframe.
Despite ETH trading at near three-month lows on July 8, Ether derivatives show minimal bearish interest. The demand for call options is twice that of put options, yet there has been no noticeable increase in volumes for neutral-to-bearish strategies involving ETH options.
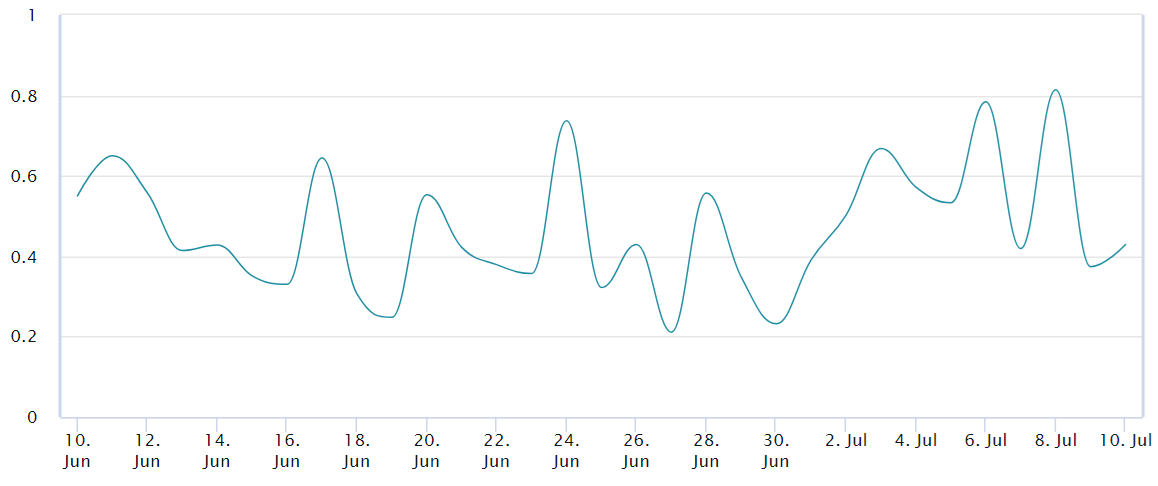
Data shows that on July 8, ETH experienced a rise of 0.8. This indicates that the volume of ETH put options traded was 20% lower compared to call options. However, this metric quickly reverted to its 7-day average of around 0.55, supporting call option volumes by 85%.
You can stay updated with the latest developments and news in the cryptocurrency markets by following Kriptospot.com.