Did Ethereum Lose Value Against Bitcoin?
- Posted on December 23, 2023 4:41 AM
- Cryipto News
- 567 Views
The observed rising wedge formation in the ETH/BTC pair indicates the potential for Ethereum to gain value against Bitcoin.

Ethereum, supported by technical analyses and indicators, is poised to rise against Bitcoin in the coming weeks.
Potential breakout of the falling wedge in ETH/BTC
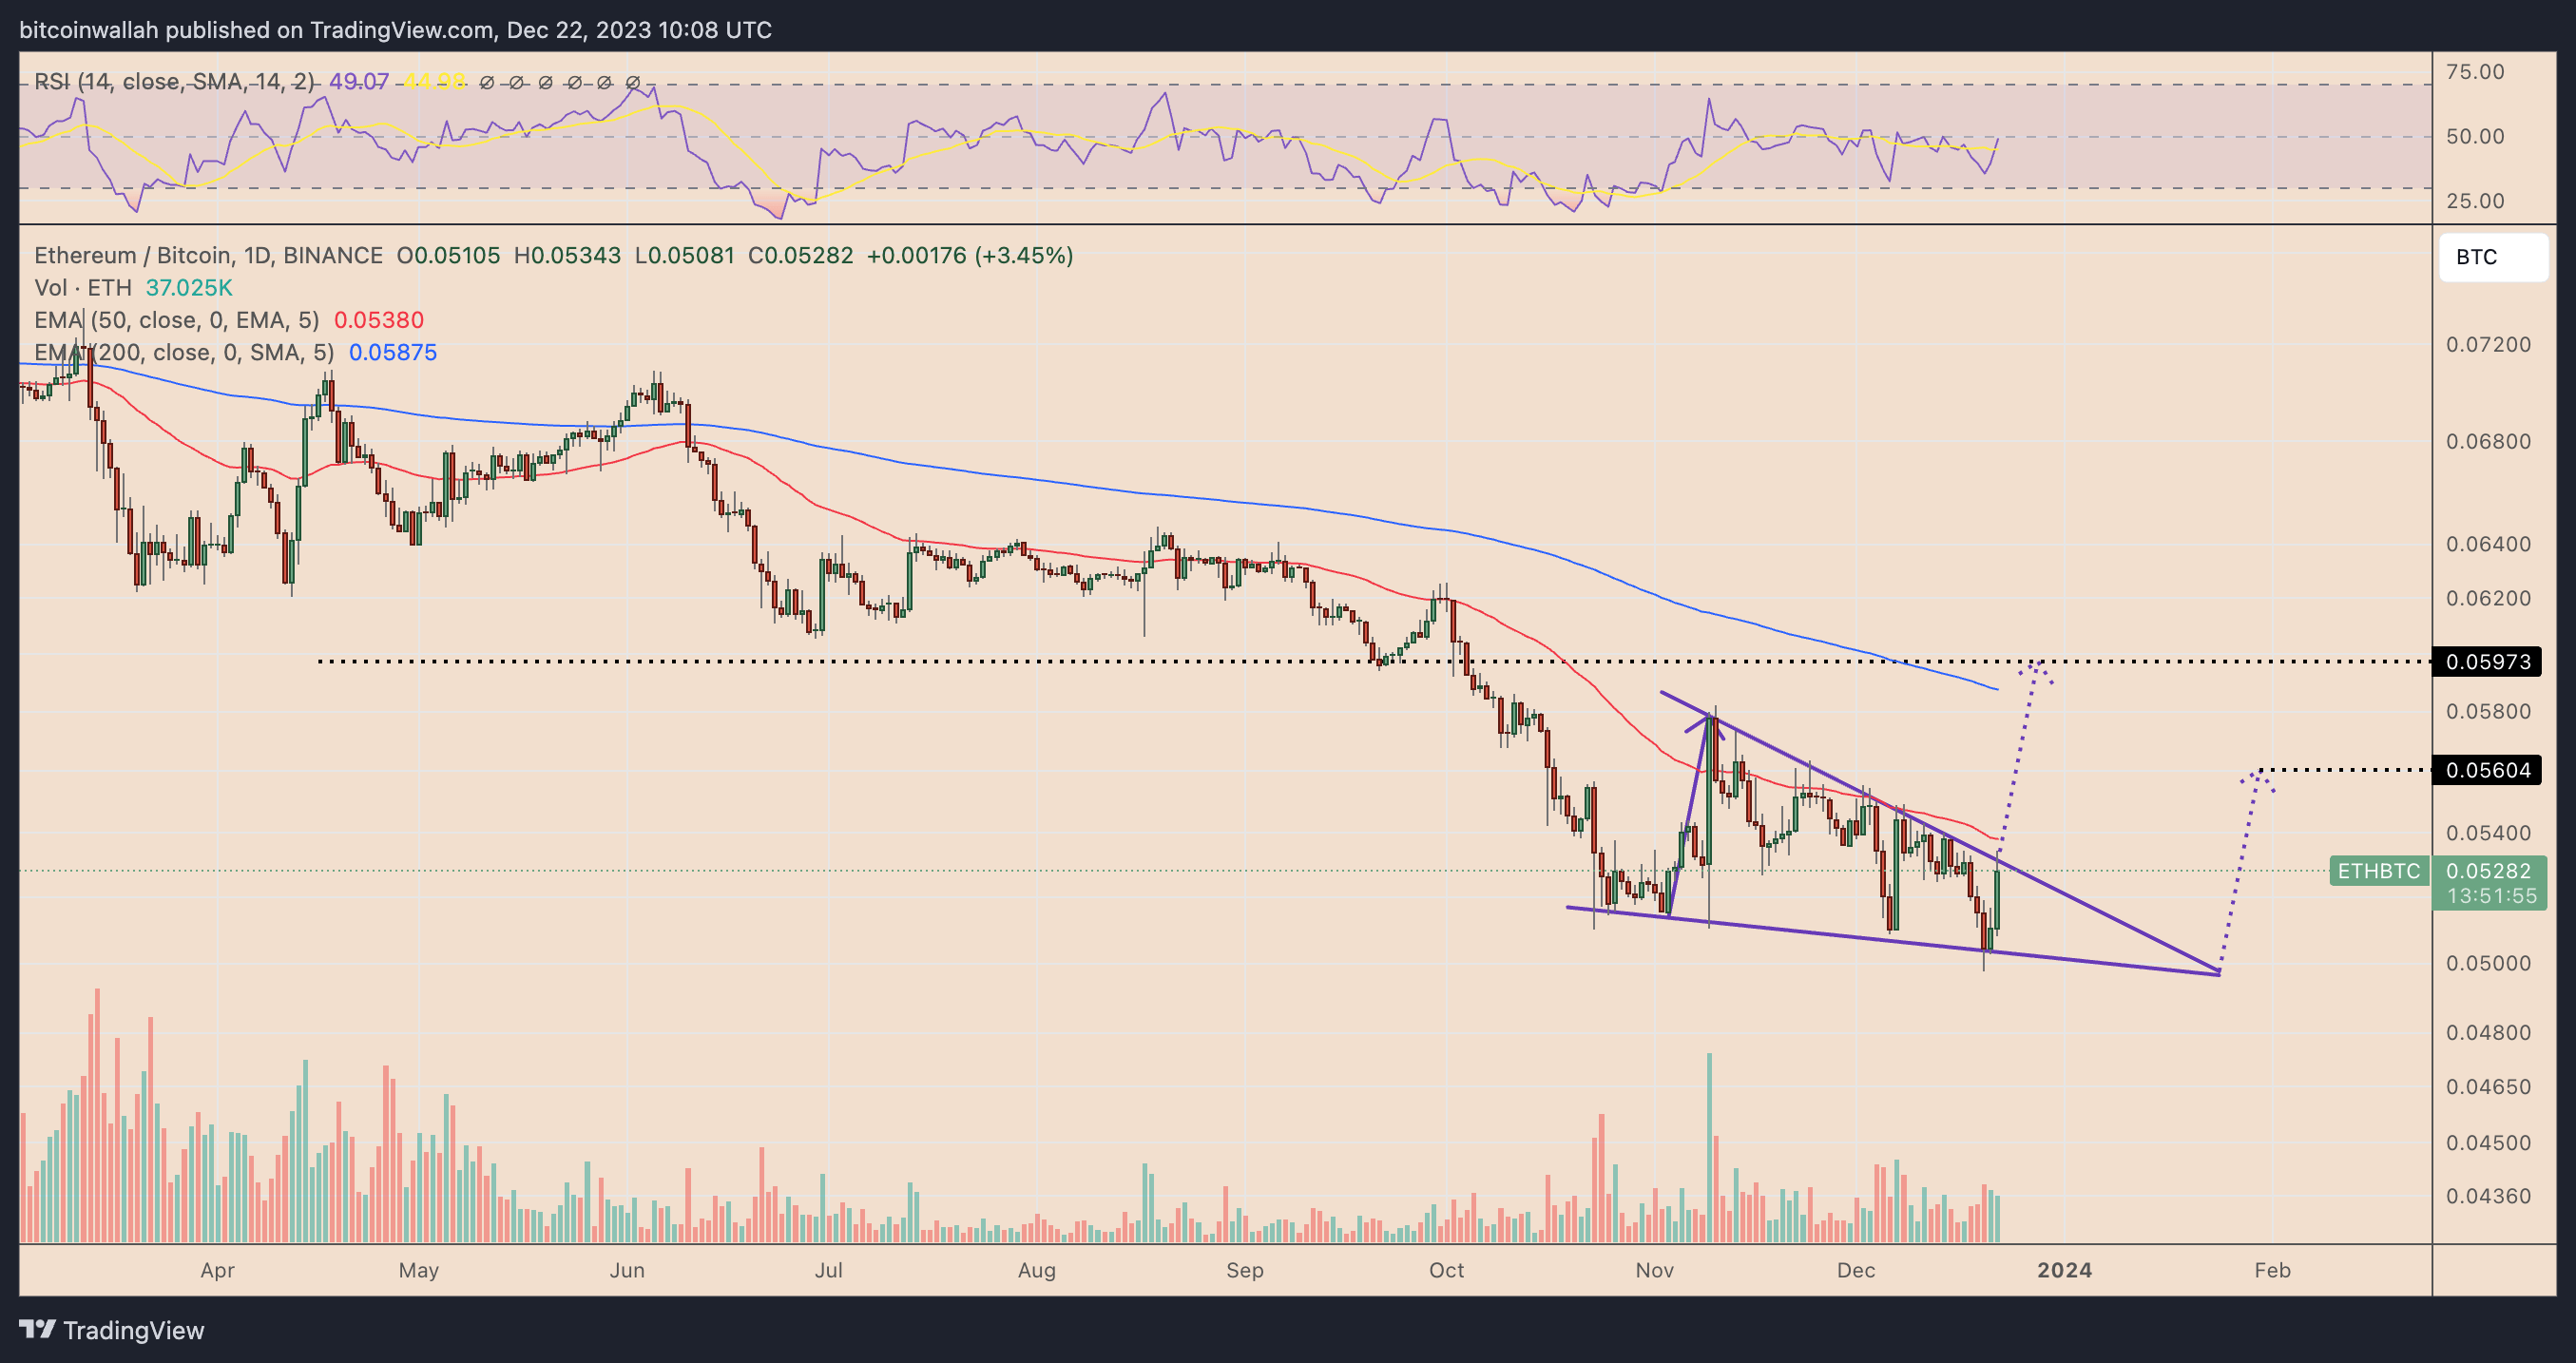
One of the key reasons behind the potential Ethereum rally is the prominent falling wedge formation.
A falling wedge is a classic trend reversal formation where the price creates descending peaks and rising troughs between two converging trend lines. After the price breaks above the upper trend line and rises to a level equal to the maximum distance between the upper and lower trend lines, a breakout occurs.
As of December 22nd, ETH/BTC is moving within a similar formation, and a breakout above the upper trend line is anticipated. Depending on the breakout point, the pair could move towards the 0.056-0.059 BTC range with an increase of approximately 6% to 13% by the new year.

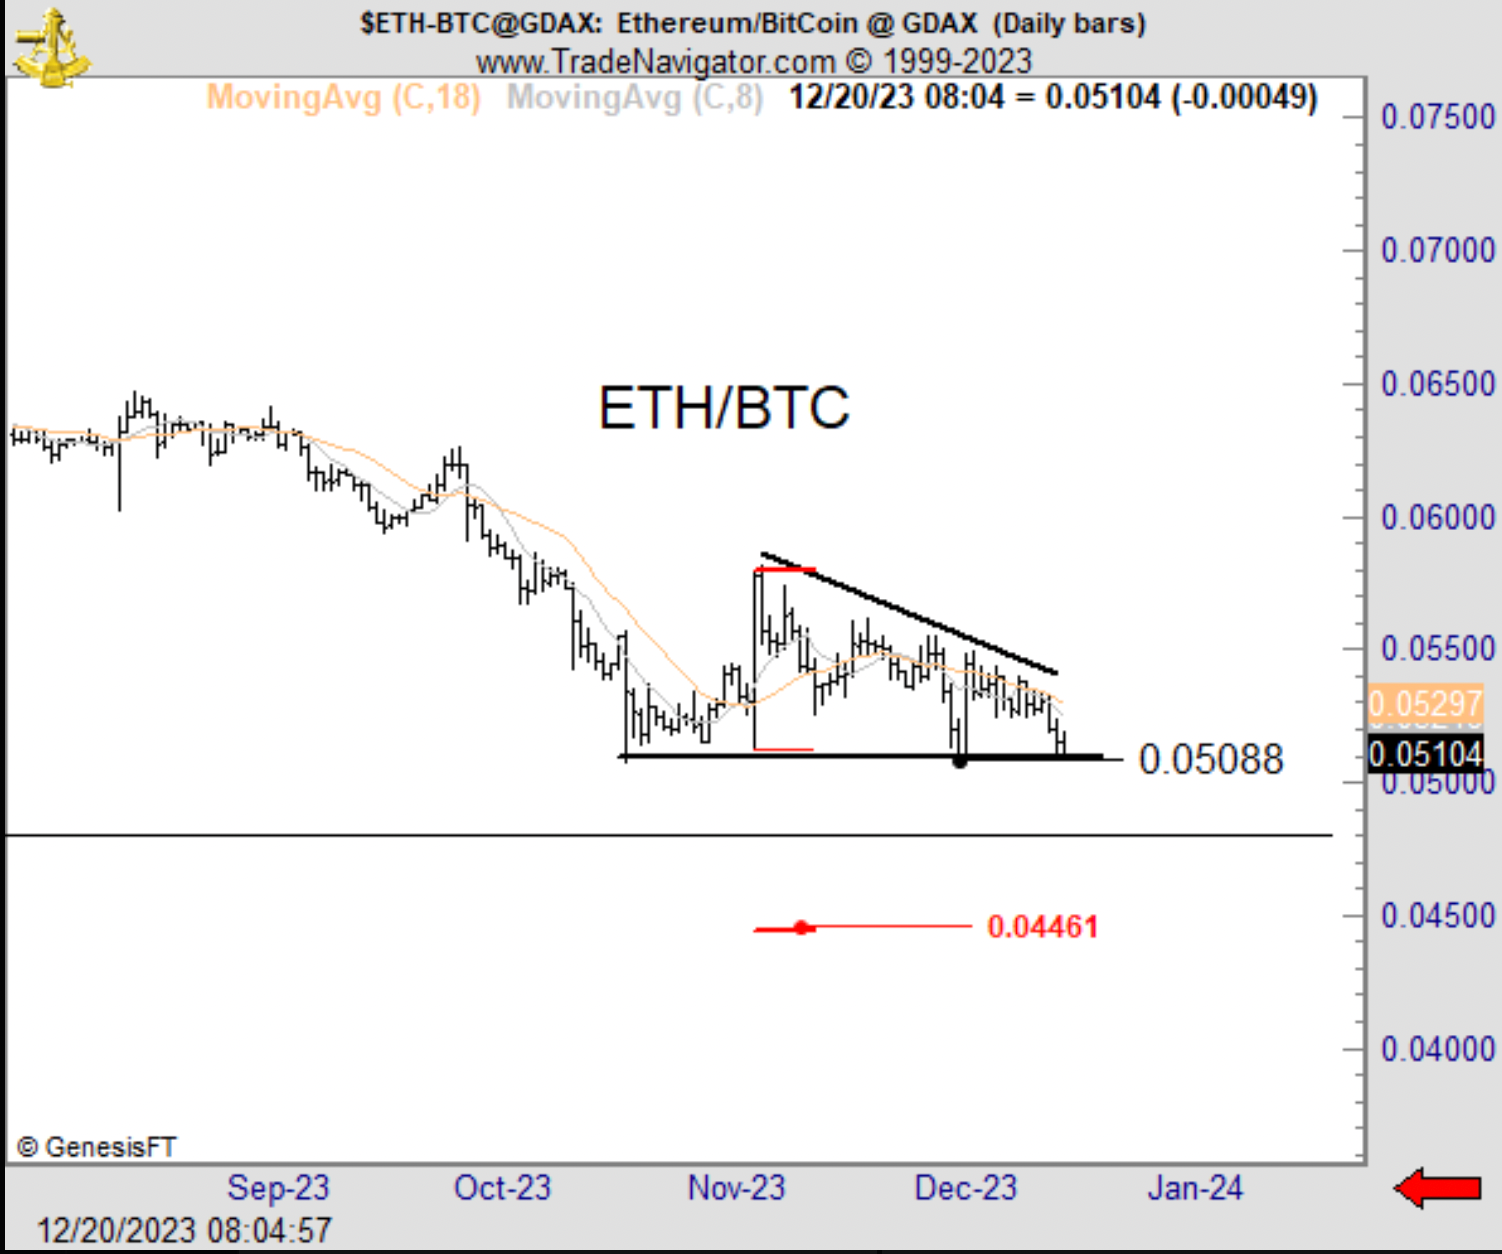
However, experienced trader Peter Brandt disagrees with the mentioned falling wedge formation, suggesting that it could be a descending triangle instead. Descending triangles are considered continuation patterns in the ongoing bearish trend for ETH/BTC over the last 15 months.

Therefore, Brandt suggests that a break below the lower trendline of the falling wedge could pull the ETH/BTC pair down by 8.5% to 0.044 BTC from current price levels.
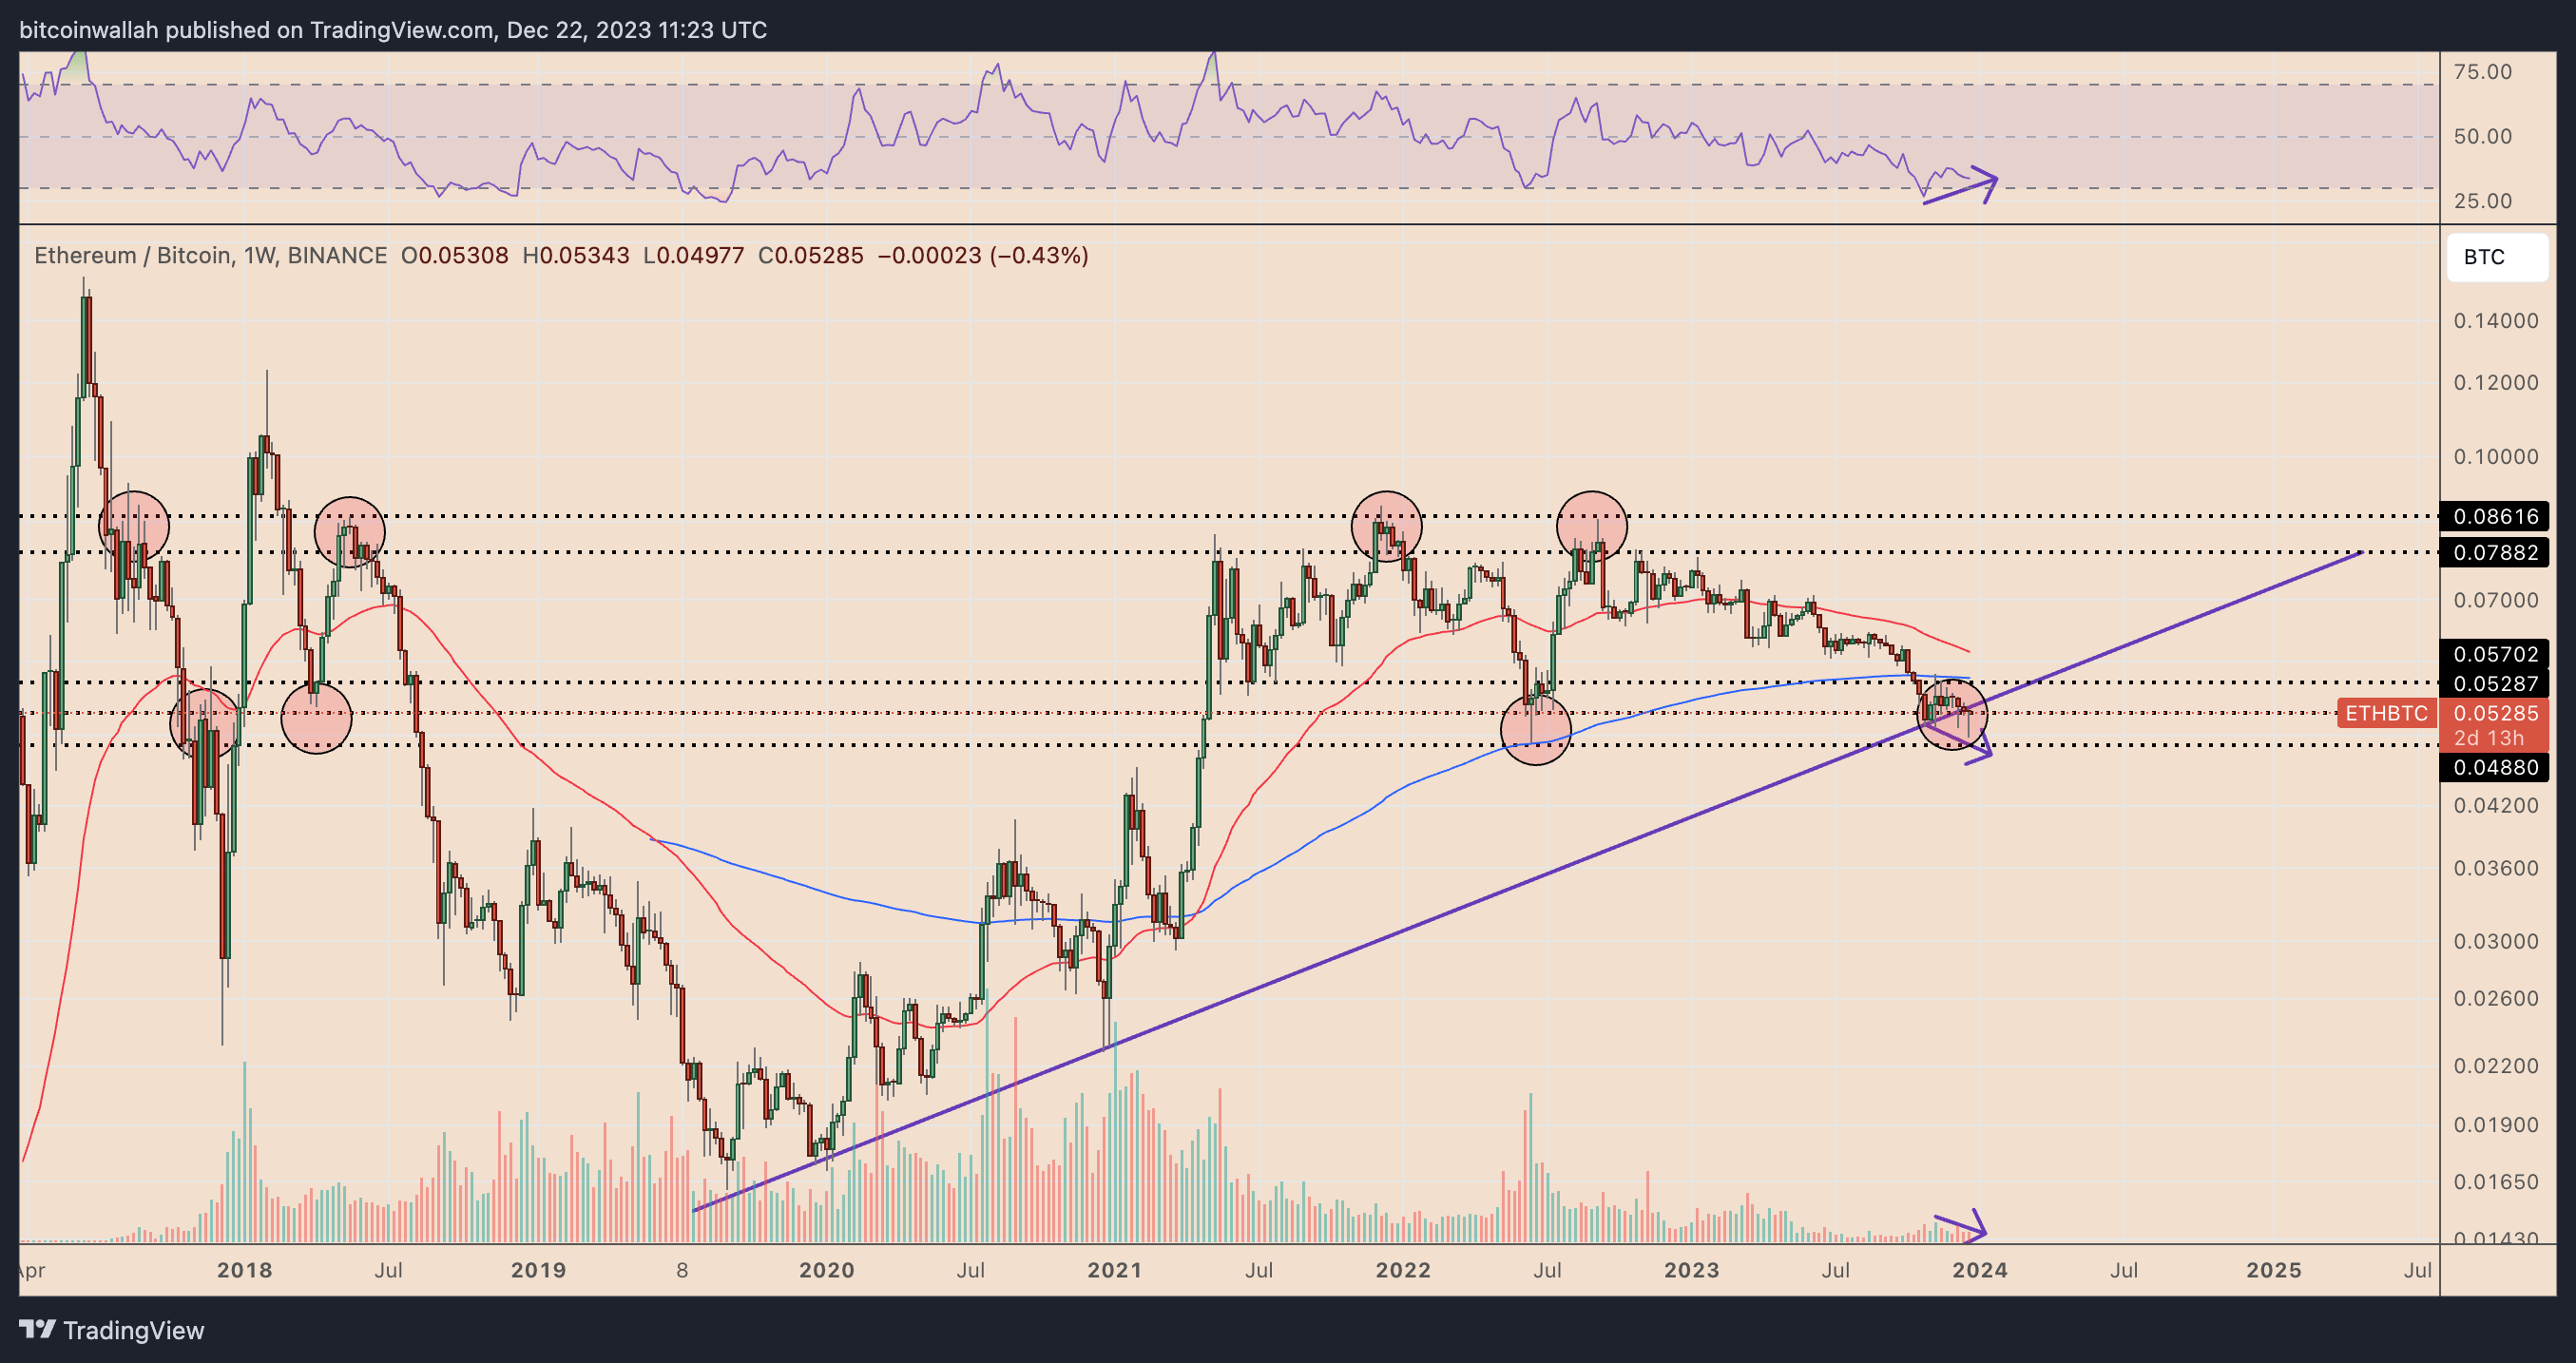
On the weekly chart, signs of an uptrend are evident, indicating a possibility of recovery in the longer term towards the end of the year and in the first quarter of 2024. For instance, while Ether's price forms descending peaks, the Relative Strength Index (RSI) is forming rising troughs on the weekly chart. This suggests a weakening downside momentum and the potential for an upcoming upward reversal.

Moreover, this price level is also in proximity to a multi-year rising trendline and a support zone ranging from 0.048 to 0.052 BTC.
The combination of these factors is expected to limit the downward movement expectations for the ETH/BTC pair in the coming weeks, enabling a potential recovery towards the 200-week EMA (blue wave) near the 0.057 BTC level by the year-end.
Bears, however, will attempt to pull down the Ethereum price to the downside, posing a risk of dropping to 0.036 BTC, a historically significant resistance level between August 2018 and September 2020.
You can stay updated on the latest developments and news in the cryptocurrency markets by following Kriptospot.com for real-time updates.

