With Bulls Pushing $52,000, Activity Begins In Altcoins.
- Posted on February 21, 2024 12:27 PM
- Cryipto News
- 895 Views
Altcoins like BNB, KAS, VET, and RNDR have the potential to continue rising.

Between February 12th and February 16th, inflows into Spot Bitcoin exchange-traded funds (ETFs) exceeded $2.2 billion, signaling strong investor interest. Bloomberg analyst Eric Balchunas noted that BlackRock iShares Bitcoin Trust (IBIT) has received inflows of $5.2 billion since the beginning of the year, representing "50% of BlackRock's total net ETF flows among 417 ETFs."
Bitcoin continued its upward trend this week, rising by approximately 7%, but bulls faced strong resistance around $52,000. One near-term concern is the possibility of the bankrupt crypto lending firm Genesis selling approximately $1.3 billion worth of Grayscale Bitcoin Trust shares to repay creditors.
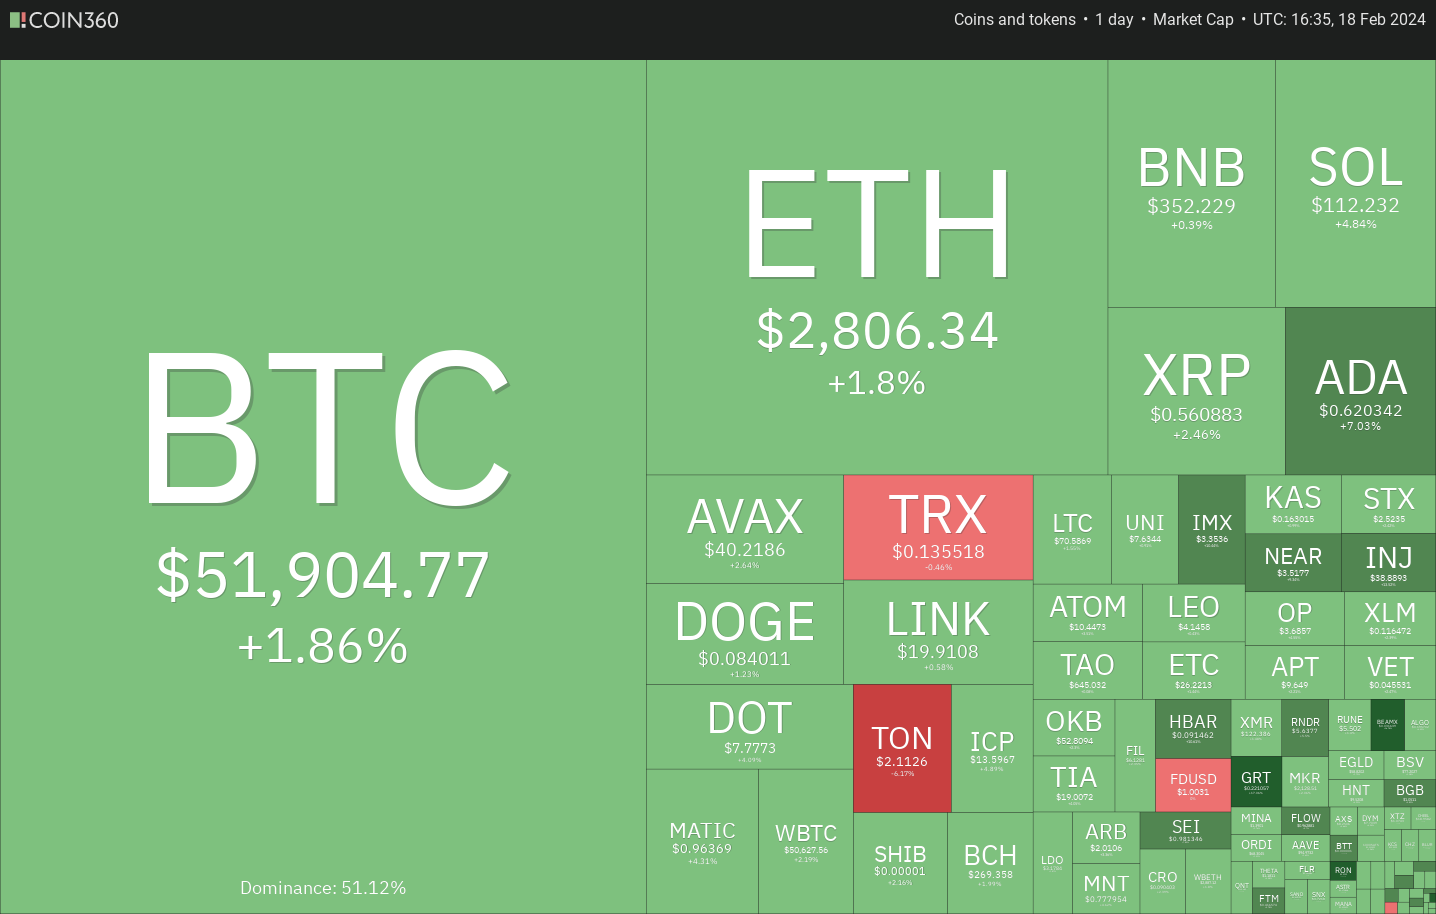
If Bitcoin experiences accumulation in the short term, interest in altcoins may increase. In the past few days, the rally is expected to continue as certain altcoins have surpassed their general resistance levels.
Can Bitcoin escape short-term selling pressure? Let's take a look at the top 5 cryptocurrencies that could continue their rise if Bitcoin avoids a correction.
Bitcoin (BTC) price analysis:
Bitcoin faces selling pressure around $52,000. Bears attempted to push the price below $50,000 on February 17th, but strong reactions indicating robust buying occurred during downward movements.
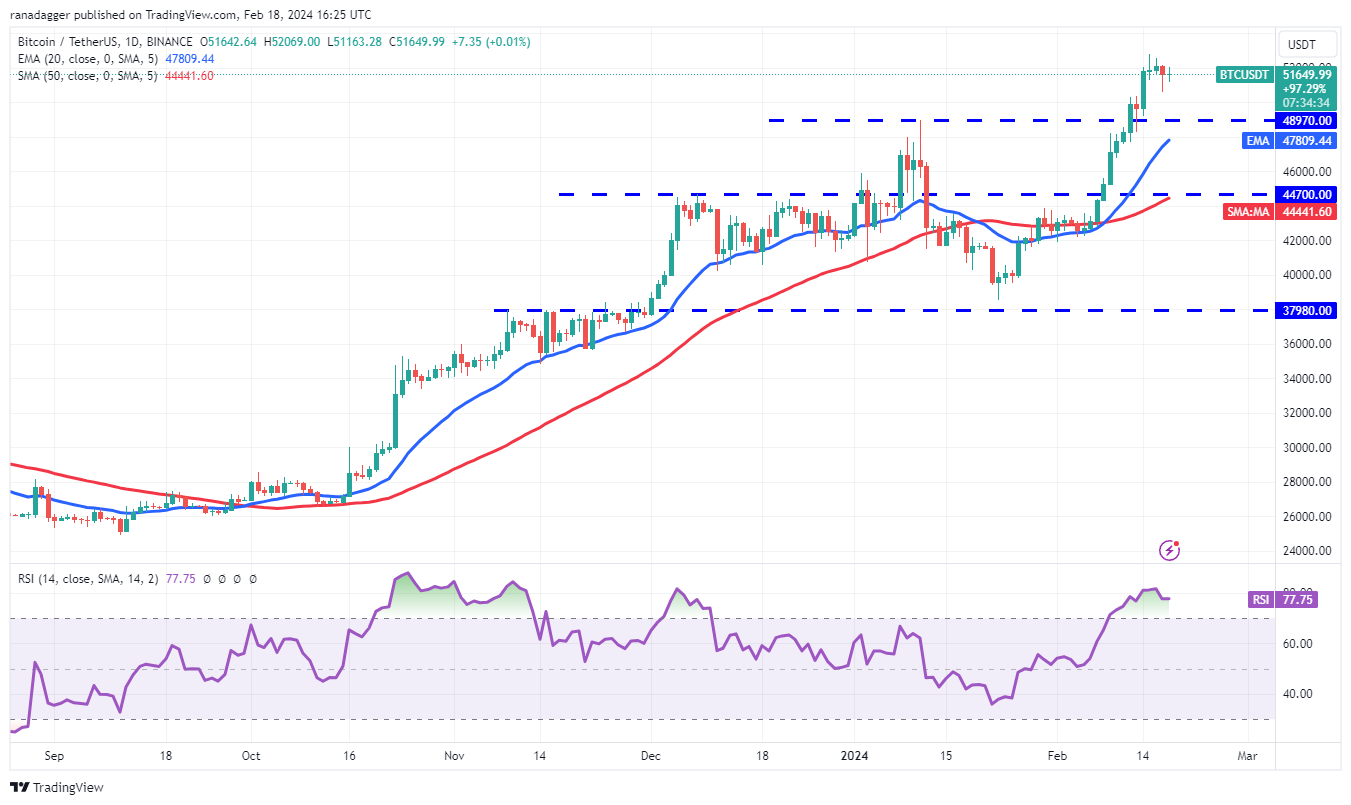
A minor correction from the $50,000 resistance level indicates that bulls still have confidence in the upward trend and are not rushing to take profits. If the price breaks out and remains above $52,000, the BTC/USDT pair could move towards $60,000.
However, there is a small risk for the continuation of the uptrend; the Relative Strength Index (RSI) has been in the overbought territory for some time. This suggests that the rally may have progressed too rapidly in the short term.
Bears will need to pull the price below the 20-day exponential moving average ($47,809) to indicate the beginning of the correction. The pair could then retreat to the level of the 50-day simple moving average ($44,441).
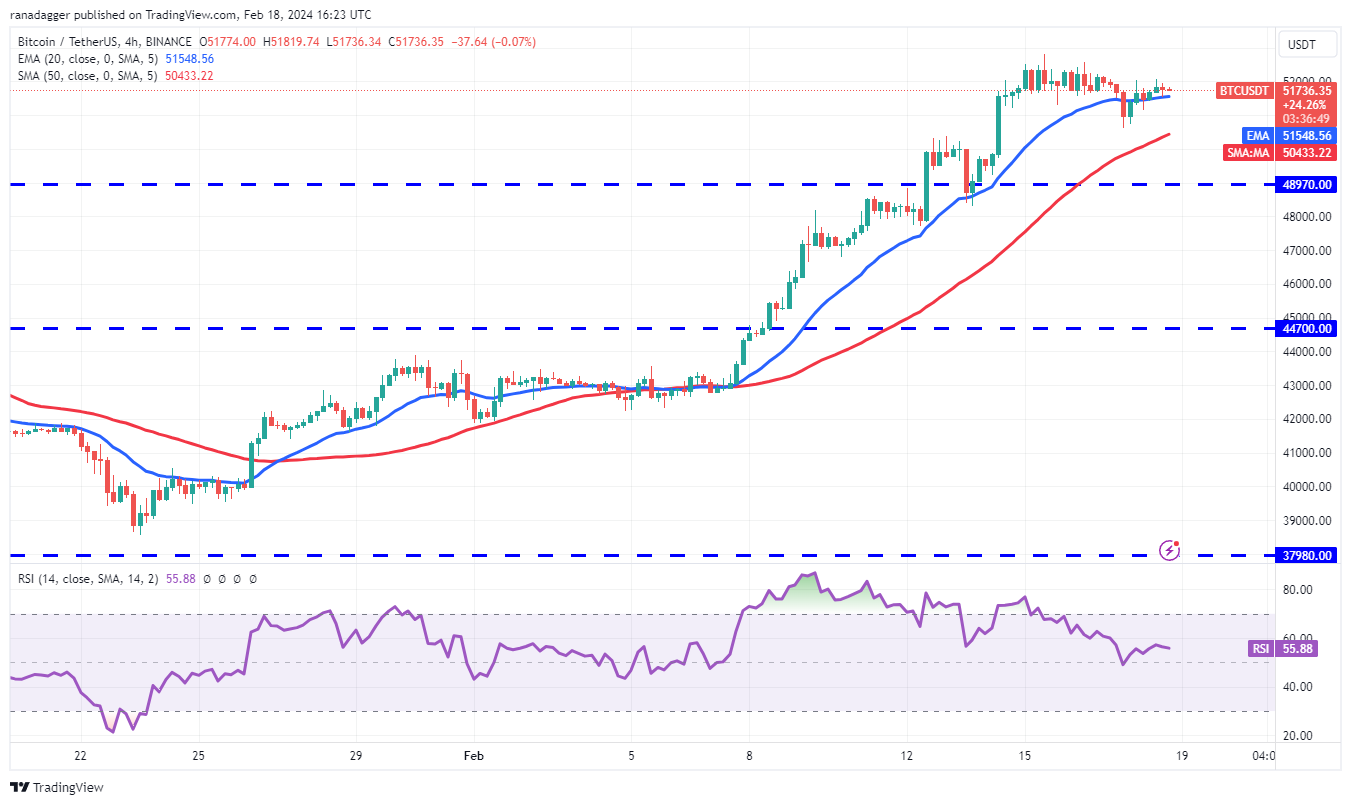
Bears managed to pull the price below the 20-period Exponential Moving Average (EMA) on the 4-hour chart, but they couldn't sustain the downward movement. This indicates that bulls are making efforts to defend this level strongly. To increase the likelihood of a move to $55,000, buyers will need to overcome the resistance at $52,817.
If bears want to hinder the upward movement, they'll need to pull the price below the moving averages. The pair could then fall towards the $48,970 breakdown level. While bulls may defend this level, failure to do so could lead the pair to $47,000 and subsequently to $44,700.
Regarding the BNB price analysis, BNB is in an uptrend but faces strong resistance at $360. A small positive aspect is that bulls have not given ground to bears.
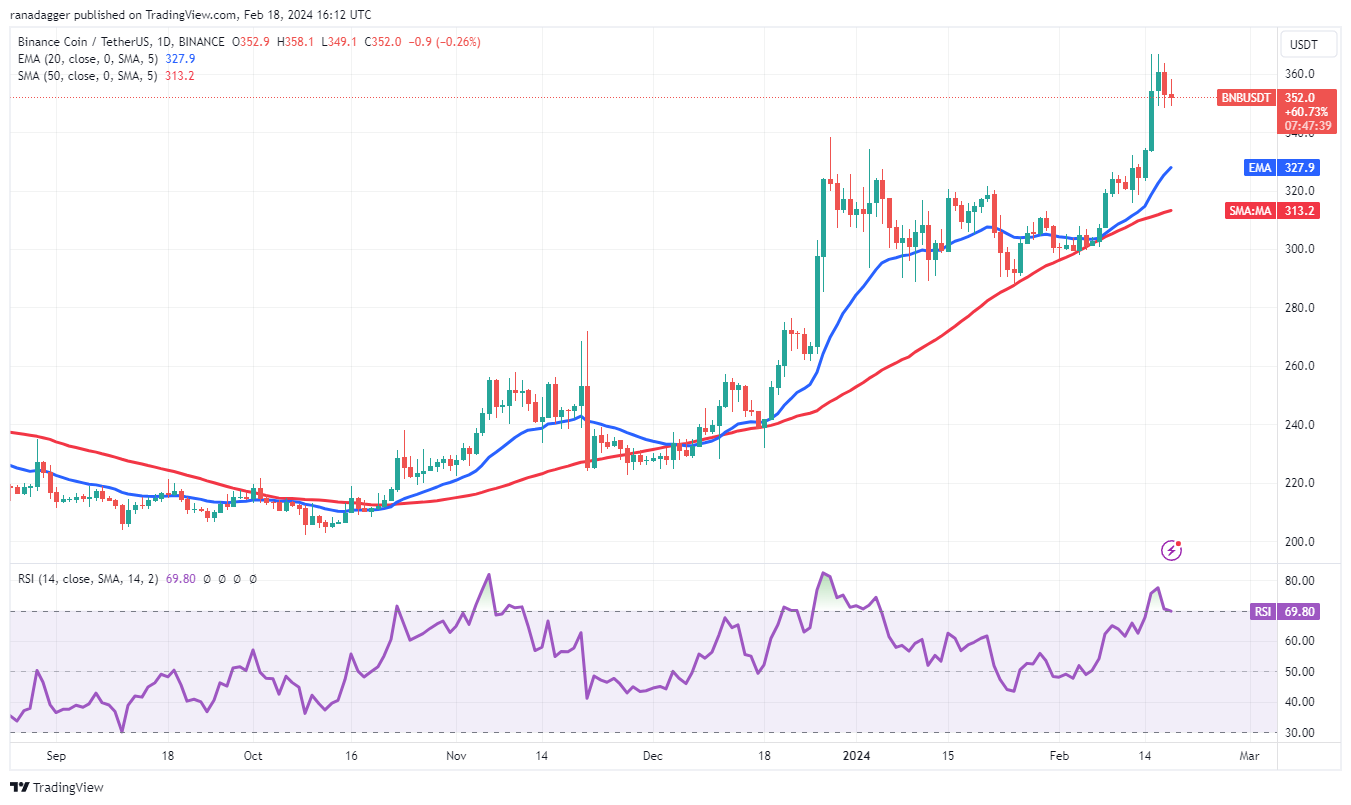
The upward-sloping 20-day Exponential Moving Average (EMA) ($328) and the Relative Strength Index (RSI) nearing overbought territory indicate that the minimum resistance is upward. If buyers manage to close above $360, the BNB/USDT pair could embark on a journey towards $400. Overcoming this level could prove to be a tough obstacle, but if successful, the next target could be $460.
On the contrary, if the price closes below $348, short-term investors may opt for profit-taking. This could initiate a correction towards the 20-day EMA and then the 50-day Simple Moving Average (SMA) ($313). If the pair closes below the 50-day SMA, it could be considered a signal of a short-term trend reversal.
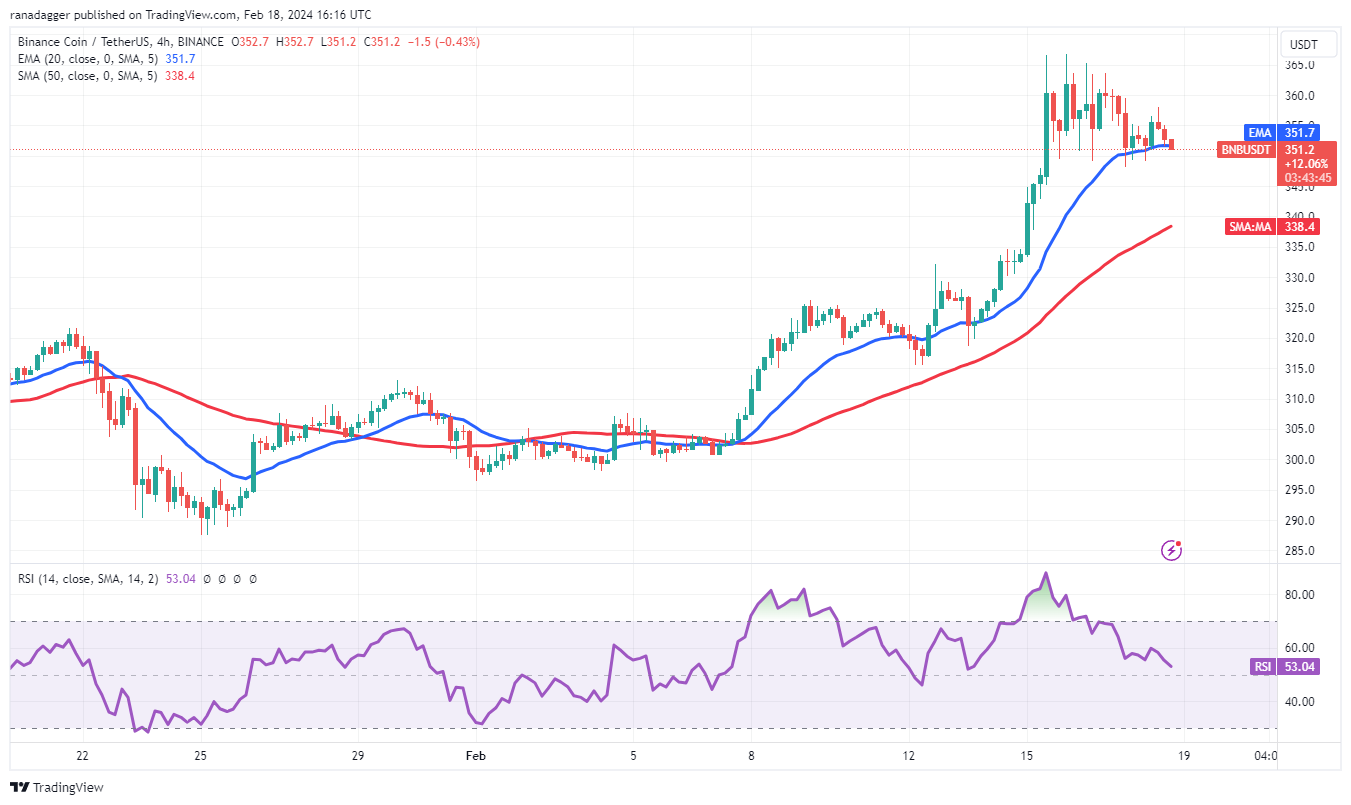
Bulls are attempting to defend the 20-period Exponential Moving Average (EMA) on the 4-hour chart, but bears continue to exert pressure. If the price reverses upwards from the current level, bulls will aim to push the pair towards $366. A breakout above this resistance would indicate the resumption of the uptrend, with the pair potentially rising to $400 thereafter.
Conversely, if the price remains below the 20-EMA, it could signal that bears have regained control. The pair may then decline towards the 50-period Simple Moving Average (SMA).
As for Kaspa (KAS) price analysis, on February 17th, it breached the general resistance level of $0.15, signaling a restart of the uptrend.
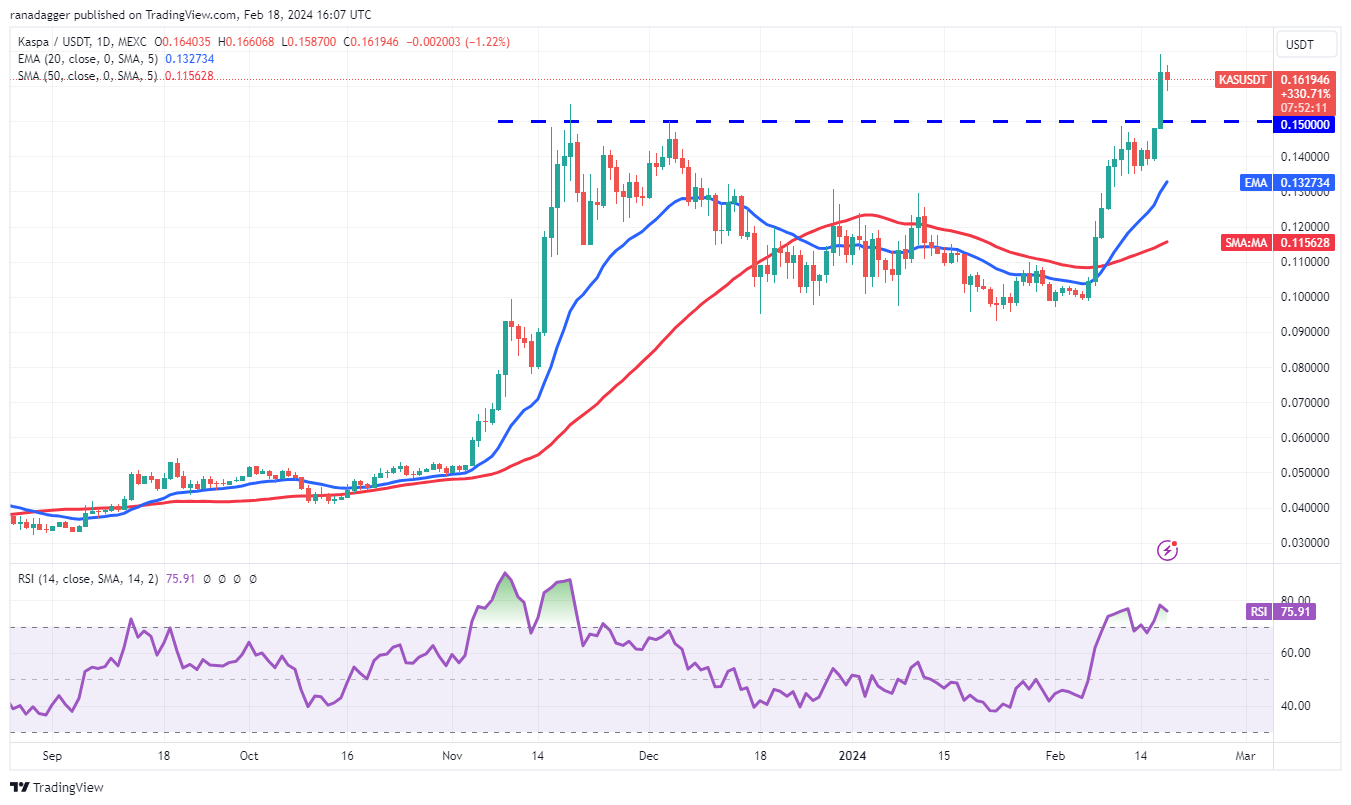
While the upward-sloping 20-day Exponential Moving Average (EMA) at $0.13 provides a significant advantage for buyers, overbought signals in the RSI suggest that the rally may have accelerated in the near term. If the price reverses downwards from the current level, it will likely find support around $0.15. A strong rebound from this level would increase the likelihood of a rise to $0.20.
On the other hand, a sharp decline in price, falling below $0.14, may indicate the end of the uptrend in the near term. In this case, the KAS/USDT pair could drop to the 50-day Simple Moving Average (SMA) at $0.11.
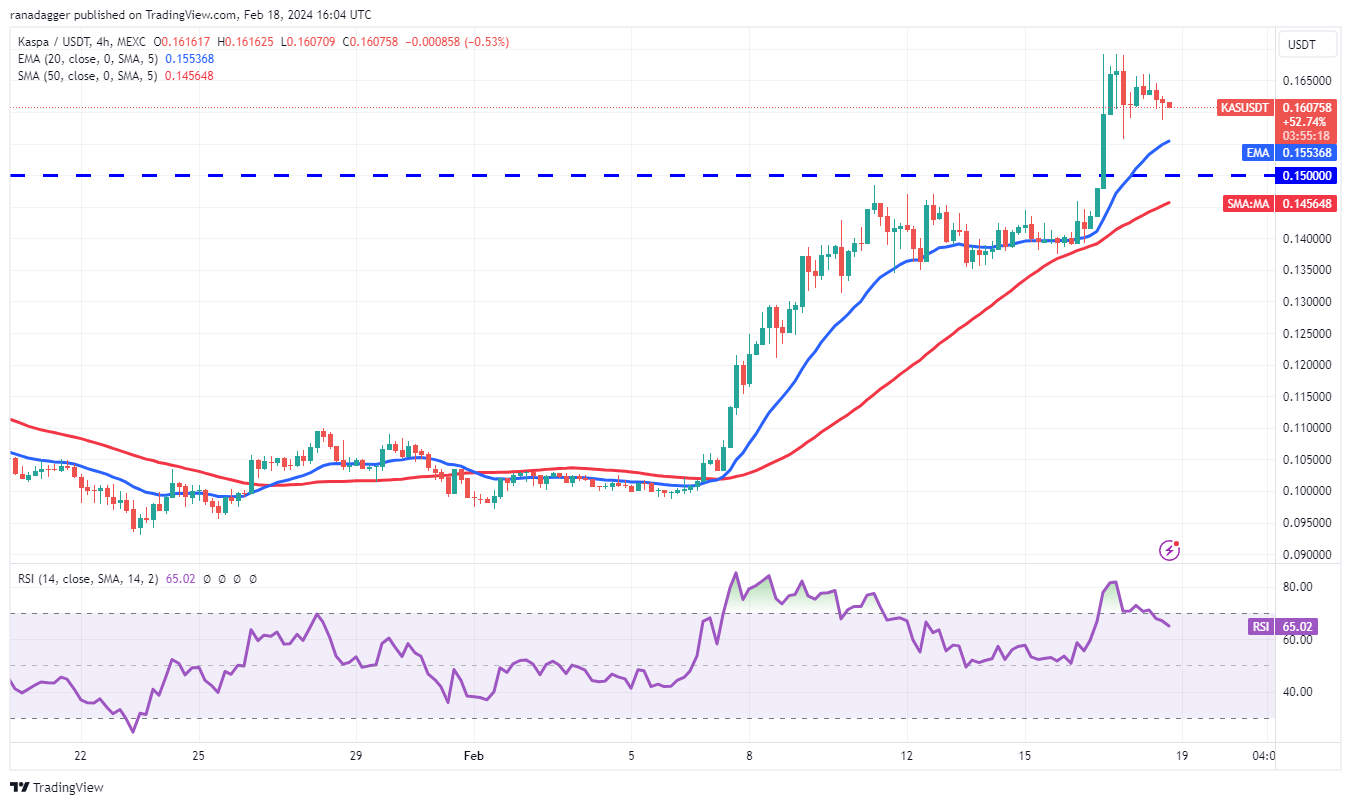
The 4-hour chart indicates that the pair is facing resistance at $0.17, but it's a positive sign that bulls are not allowing the price to fall below the 20-day Exponential Moving Average (EMA). Upward-moving averages and the RSI nearing overbought territory suggest an advantage for buyers. If the price breaks above $0.17, there's a high probability that the uptrend could continue towards $0.20.
Buyers are expected to defend the zone between the 20-EMA and the 50-SMA during any correction. Falling below the 50-SMA could indicate that bears have regained control.
VeChain (VET) Price Analysis:
VeChain showed signs of aggressive buying as it rose above the 50-day Simple Moving Average (SMA) at $0.03 on February 12th.
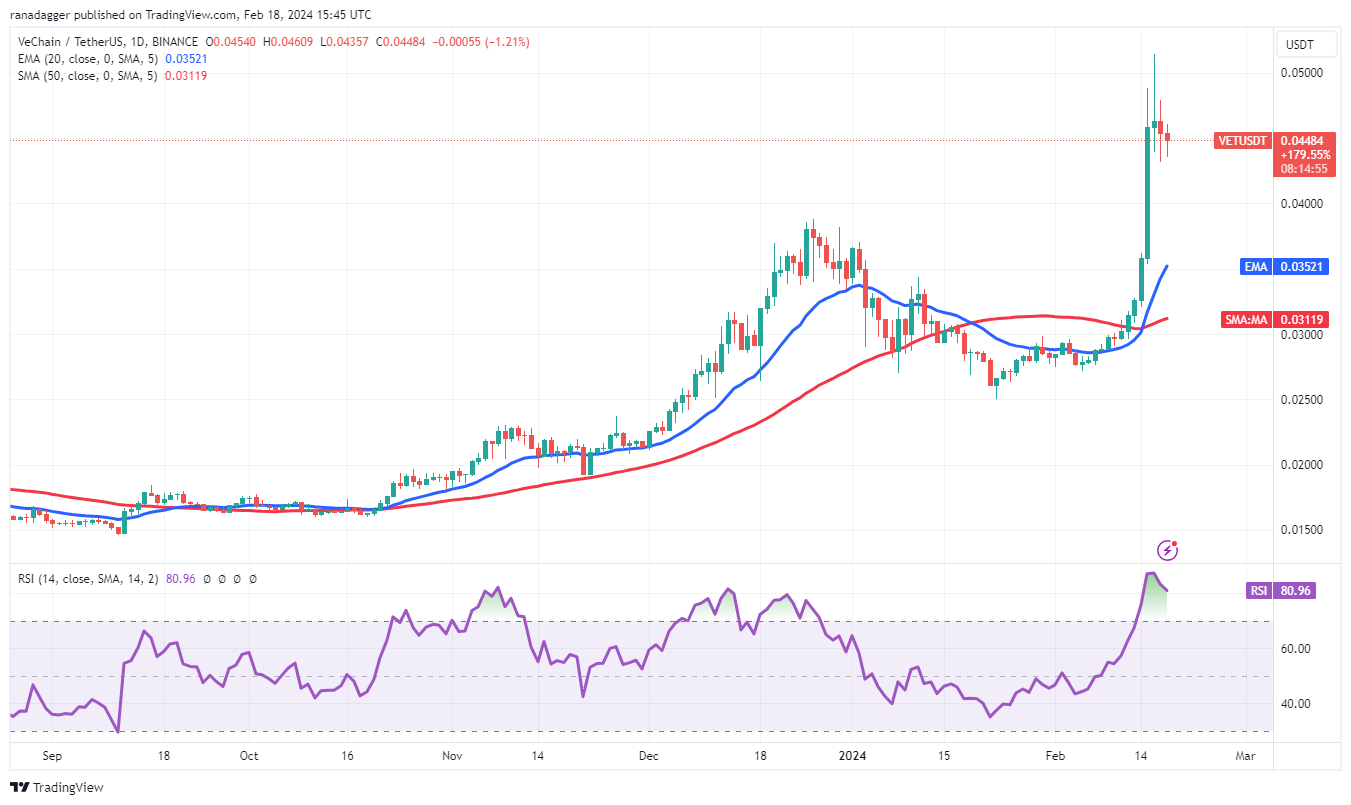
The VET/USDT pair signaled the beginning of the next leg of the uptrend by surpassing the general resistance at $0.04 on February 15th. However, the long wick on the candlestick on February 16th indicates that bears attempted to halt the upward movement around $0.05.
If buyers do not step back, the likelihood of the upward movement continuing increases. If the price remains above $0.05, the pair could rise to $0.07.
However, if the price continues to fall and drops below $0.04, it may indicate that bulls rushed for an exit. The pair could then decline towards the moving averages.
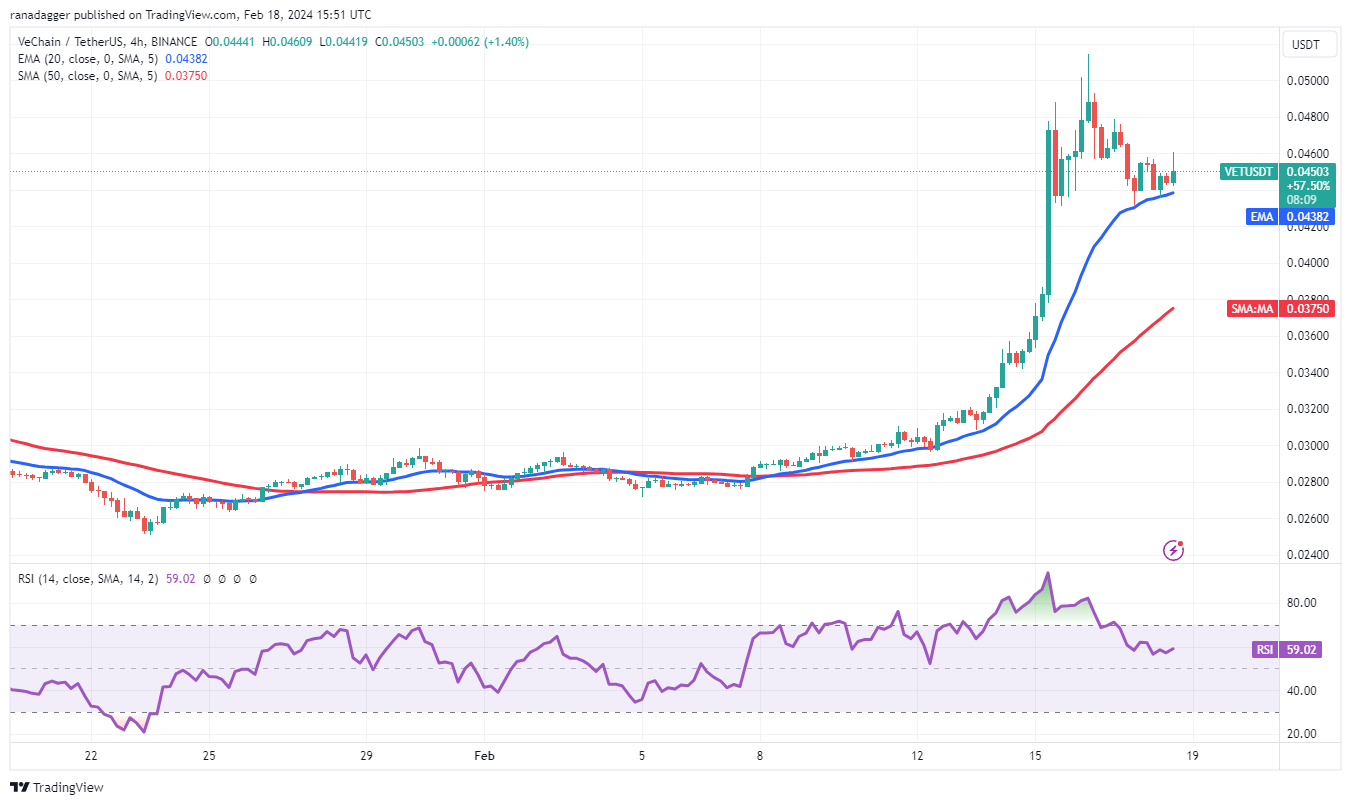
Bulls are attempting to halt the retreat at the 20-EMA on the 4-hour chart. If the price rises from the current level and surpasses $0.05, it would indicate positive momentum and show that investors continue to buy on dips.
However, if the price falls below the 20-EMA, bulls may engage in profit-taking. If the price remains below the 20-EMA, the pair could decline towards the 50-SMA. This could delay the start of the next leg of the rally.
Render (RNDR) Price Analysis
Render (RNDR) signaled the resumption of the uptrend by breaking above the general resistance level at $5.28 on February 15th and closing the day above this level.
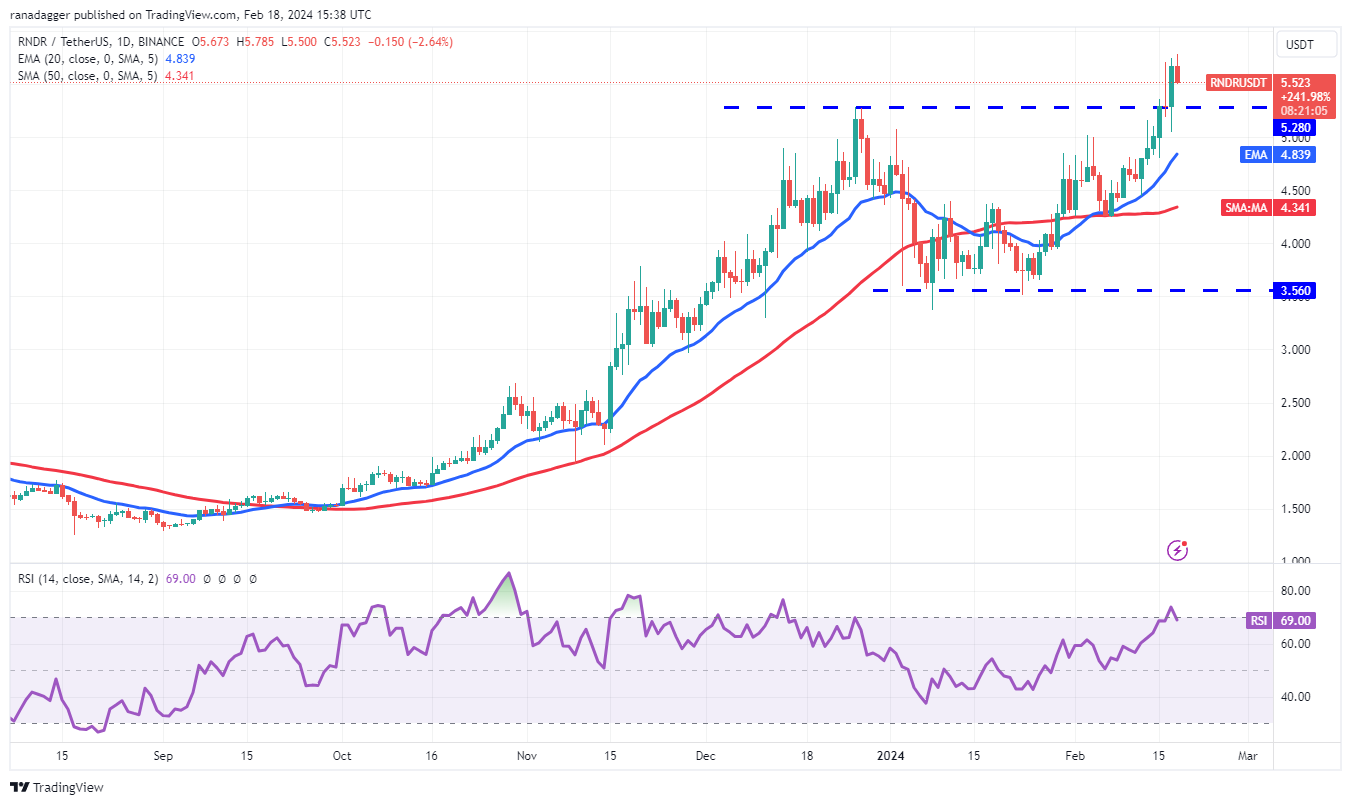
Bears attempted to pull the price below the breakout level on February 17th, but bulls managed to hold their ground. This indicates that buyers are striving to turn the $5.28 level into support. If successful, the RNDR/USDT pair could rise towards the formation target of $7.
The rally of the past few days has pushed the RSI into overbought territory, suggesting the possibility of a minor correction or consolidation. However, a breakdown and close below $5 could signal weakness, trapping aggressive bulls, and the pair could then decline towards the 50-day SMA ($4.34).
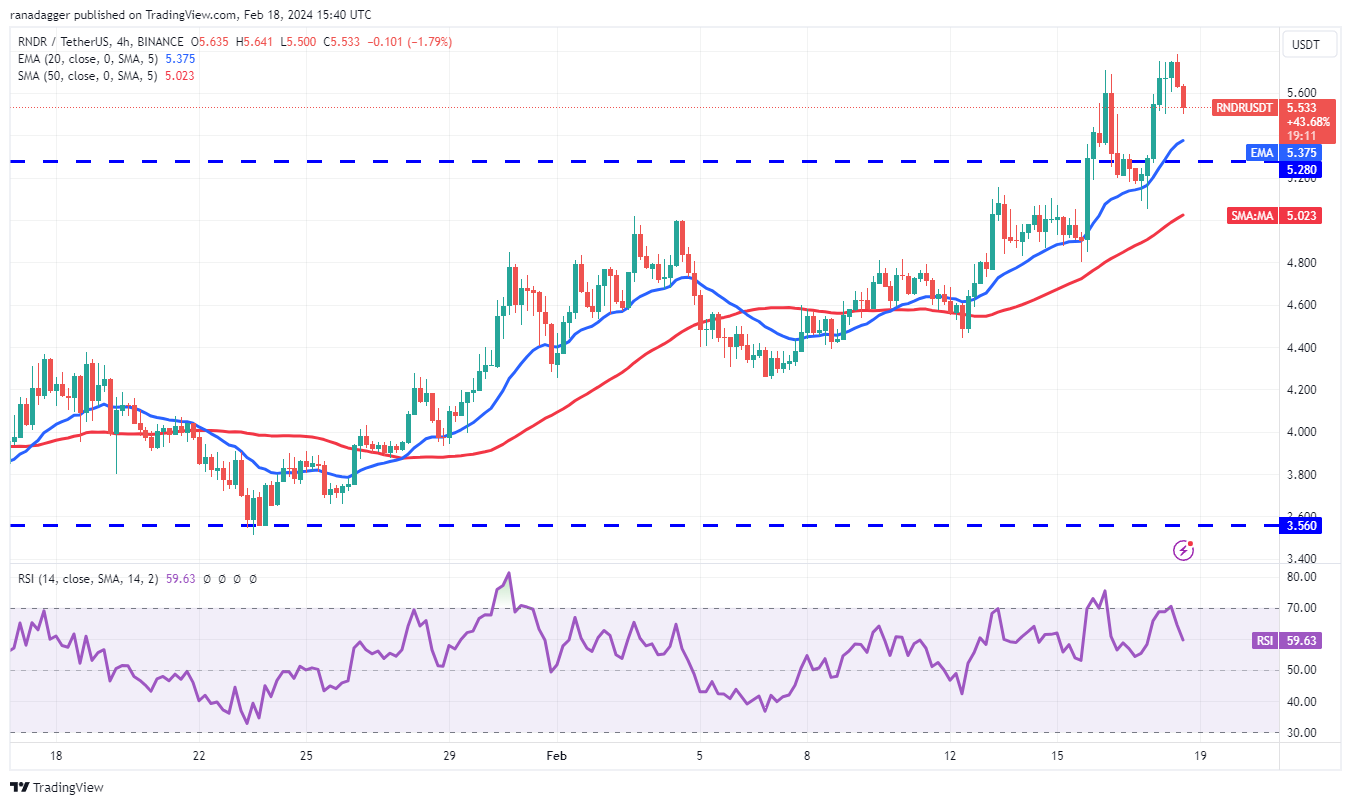
The upward movement of the moving averages on the 4-hour chart and the RSI nearing 60 indicate bullish dominance. If the price rises above $5.71, the pair could head towards $6. Maintaining the price above the 20-EMA would support the bullish trend.
However, the RSI's creation of a negative divergence suggests a potential slowdown in bullish momentum. If the price falls below the 20-EMA, there is a high probability of further decline towards the 50-SMA. A breakdown below this level could trigger a drop towards $4.40.
You can stay updated on the latest developments and news in the cryptocurrency markets by following Kriptospot.com.